Personal finance involves managing one’s financial resources to achieve financial goals. It includes budgeting, saving, investing, and planning for retirement. In the context provided, the individual has a current value of INR 1,00,000 and desires monthly expenses of INR 12,00,000 today, which will increase to INR 49,68,675 by retirement age due to a 7% inflation rate. The retirement age is set at 50, and the current age is 29.
The individual is considering different financial independence and retirement early (FIRE) goals:
1. Lean FIRE: Requires a nest egg of INR 7,45,30,123.
2. FIRE: Requires a nest egg of INR 12,42,16,871.
3. FAT FIRE: Requires a nest egg of INR 24,84,33,742.
These goals are based on the assumption that the individual will need to withdraw a certain percentage of their nest egg annually to sustain their desired lifestyle in retirement.
• Lean FIRE: ₹5,22,40,740
This is the minimum amount needed to retire early with a frugal lifestyle.
• FIRE: ₹8,70,67,900
The standard FIRE target for a comfortable, middle-class lifestyle.
• Fat FIRE: ₹17,41,35,801
The amount needed for a more luxurious lifestyle in retirement.
Budget Example (Year 1-3):
• Income: Starts at ₹1,00,000 per year, increasing by 10% each year (₹1,10,000 in Year 2, ₹1,21,000 in Year 3).
• Expense: Starts at ₹60,000, also increasing by roughly 7-8% per year.
• Savings: The difference between income and expense, growing each year (₹40,000, ₹45,800, ₹52,306).
• Savings Rate: 15% in Year 1, 14% in Year 3 (likely calculated as savings divided by income).
There is a disclaimer stating this tool is for educational purposes only and not investment advice.
Image 2: SIP (Systematic Investment Plan) Calculator
This is a projection of how much wealth can be accumulated by investing regularly in mutual funds via SIP:
• Invested Amount: ₹1,37,46,000
Total money put into SIPs over 20 years.
• Returns Generated: ₹2,35,16,767
The profit earned from investments over 20 years.
• Total Amount: ₹3,72,62,767
The sum of invested amount plus returns after 20 years.
• Monthly SIP Amount: ₹20,000
Amount invested every month.
• Step Up (Yearly): 10%
SIP amount increases by 10% every year.
• Expected Return (Per Year): 12%
Average annual return assumed from investments.
• Time Period: 20 years
Asset Classes and Expected Returns:
• Cash: 0%
Cash holdings are shown to provide no returns, highlighting the lack of growth when money is kept idle.
• Fixed Deposits: 7–8%
Fixed deposits are low-risk, fixed-income investments, typically offering moderate returns.
• Bonds: 9–12%
Bonds are debt instruments with slightly higher returns than fixed deposits, reflecting their moderate risk profile.
• Gold: 8–12%
Gold is presented as both a hedge and an investment, offering returns in a similar range to bonds.
• Mutual Funds: 12–15%
Mutual funds pool money from various investors to invest in diversified portfolios, generally yielding higher returns than fixed deposits and bonds.
• Stocks: 15–25%
Stocks are shown to have the potential for the highest returns among traditional assets, but they also come with higher risk.
• Real Estate: 7–10%
Real estate investments offer moderate returns and can provide both income and capital appreciation.
• Crypto: >50%
Cryptocurrencies are depicted as the most volatile asset class, with the potential for very high returns, but also significant risk.
Indian Household Asset Ownership Breakdown
The image presents a pie chart detailing the composition of Indian household assets as of March 2024, with a total value of US $12.8 trillion. The data is sourced from Zerodha, RBI, and Jefferies.
Asset Allocation (Percentage of Total Assets)
- Property: 51.3%
- Gold: 15.2%
- Bank Deposits: 13.3%
- Insurance Fund: 5.7%
- Provident & Pension Funds: 5.7%
- Equity: 5.8%
- Cash: 3.0%
Key Insights
- Dominance of Physical Assets: Over half of Indian household wealth is held in property (real estate), making it the largest asset class by a significant margin.
- Gold Holdings: Gold remains a traditional and significant store of value, accounting for over 15% of household assets.
- Financial Assets: Bank deposits, provident and pension funds, insurance, and equity together comprise a substantial portion, but individually each is much smaller than property or gold.
- Low Equity Exposure: Equity investments form only 5.8% of total assets, indicating relatively low direct participation in stock markets by Indian households.
- Cash Holdings: Cash accounts for 3%, reflecting a preference for liquidity but at a much lower proportion compared to other assets.
This distribution highlights the conservative investment approach prevalent among Indian households, with a strong preference for tangible and relatively safer assets like property and gold, and comparatively limited exposure to riskier financial instruments like equities.
Debt Assets Explained
Debt assets are financial instruments that represent a loan made by an investor to a borrower (such as a corporation, government, or individual). The borrower agrees to pay back the borrowed amount (principal) along with interest over a specified period. Debt assets are typically considered lower-risk compared to equity assets because they offer fixed or predictable returns and have a defined maturity period.
Key Features of Debt Assets
- Fixed Income: Debt assets generally provide regular interest payments (also called coupons) to the investor.
- Principal Repayment: At maturity, the borrower repays the original amount invested.
- Lower Risk: Debt assets are typically less risky than equity because they have priority in repayment if the issuer faces financial trouble.
- Short to Long-Term: Debt assets can have varying maturities, from a few months (short-term) to several decades (long-term)[1][2].
Common Examples of Debt Assets
Type of Debt Asset Description Example Instruments Bonds Issued by governments or corporations; investors receive interest payments Government bonds, corporate bonds Debentures Unsecured bonds, backed only by issuer’s creditworthiness Corporate debentures, government debentures Certificates of Deposit Fixed-term deposits issued by banks Bank FDs (Fixed Deposits) Commercial Paper Short-term unsecured promissory notes issued by companies CPs issued by large corporations Loans Borrowed sums from banks or institutions, repaid with interest Personal loans, business loans, mortgages Treasury Bills Short-term government securities with maturities of less than a year Indian T-bills Notes Written promises to pay a certain amount at a future date Promissory notes Lines of Credit Flexible borrowing up to a set limit, interest paid only on used amount Bank overdraft, business credit lines
Indian Context
In India, common debt assets include:
- Government securities (G-Secs)
- Corporate bonds
- Non-convertible debentures (NCDs)
- Bank fixed deposits
- Public Provident Fund (PPF)
- Commercial paper
How Debt Assets Work
When you invest in a debt asset, you are essentially lending money to the issuer. In return, you receive:
- Periodic interest payments (fixed or variable)
- Repayment of principal at maturity
For example, if you buy a government bond, you lend money to the government, which pays you interest at regular intervals and returns your principal at the end of the bond’s term[1][2][3].
Why Use Debt Assets in Short-Term Strategies?
Debt assets are favored for short-term investment strategies (like the one shown in the image) because:
- They offer capital protection and predictable returns.
- They are less volatile than equity investments.
- They suit investment horizons of 1–3 years, aligning with short-term financial goals[4][5].
Summary
Debt assets are instruments where investors lend money to issuers (governments, companies, individuals) in exchange for regular interest and principal repayment. Examples include bonds, debentures, loans, certificates of deposit, and commercial paper. These assets are commonly used in short-term asset allocation strategies for their safety and predictability[1][2][3].
Explanation of the Slide
The slide presents a comparison between two investment options: Small Finance Bank Fixed Deposits (FDs) and Bonds. It helps investors understand the potential returns, tax implications, and post-tax returns for each option.
Key Points Compared
Particulars Small Finance Bank FD Bonds Returns 8-9% 9-12% Tax 30% 30% Post Tax Return 6%-7% 7%-8%
Returns
- Small Finance Bank FDs offer an interest rate of 8-9%.
- Bonds offer a higher interest rate range of 9-12%.
Tax
- Both investment options are subject to a 30% tax rate on the returns.
Post Tax Return
- After accounting for taxes, Small Finance Bank FDs yield a net return of 6%-7%.
- Bonds provide a slightly higher post-tax return of 7%-8%.
What Does This Mean?
- Bonds generally offer higher returns than Small Finance Bank FDs, both before and after tax.
- The tax treatment is the same for both options, so the difference in net returns is primarily due to the higher interest rates offered by bonds.
- Investors looking for better post-tax returns might consider bonds over small finance bank FDs, provided they are comfortable with the risk profile and liquidity of bonds.
Conclusion
This slide is guiding investors to compare their fixed-income investment options not just on the basis of gross returns, but also on the basis of post-tax returns, which reflect the actual earnings after taxes are deducted. Bonds, in this comparison, appear to be the more attractive option for maximizing post-tax income.
Upto 5 lakhs you are insured by RBI for bonds and small bank finance.
Explanation of the Slide: “What kind of returns can I expect from Bonds?”
The slide presents a visual guide to the returns you can expect from different types of bonds, categorized by risk and issuer type.
Key Elements
1. Return Ranges
- The slide shows a spectrum of expected returns:
- Low: 5–7%
- Low to Moderate: 7–8%
- Moderate: 8–9%
- Moderately High: 10–12%
- High: Above 12%
2. Risk Ratings
- The center of the chart lists credit ratings, which indicate the risk level:
- AAA: Highest safety, lowest risk
- AA: Very high safety
- A: High safety
- BBB: Moderate safety
- Below BBB: Higher risk
3. Issuer Examples
- The outer ring shows examples of issuers for each risk/return category:
- Government of India: Lowest risk, lowest returns (5–7%)
- REC, SBI, Yes Bank, Muthoot: Moderate risk and returns (7–9%)
- Piramal, Navi: Higher risk, higher returns (10–12%)
- SATYA, KNF, NBFCs: Highest risk, highest returns (above 12%)
How to Read the Chart
- Safer bonds (like Government of India bonds) offer lower returns but are more secure.
- As you move towards the right (higher returns), the risk increases, with private companies and NBFCs offering higher returns but with greater risk of default.
- The credit rating (AAA to below BBB) helps you gauge the safety of the bond: higher ratings mean lower risk and lower returns, while lower ratings mean higher risk and potentially higher returns.
Summary Table
Risk/Return Category Expected Returns Example Issuers Credit Rating Low 5–7% Govt. of India AAA Low to Moderate 7–8% REC, SBI, Yes Bank, Muthoot AA Moderate 8–9% A Moderately High 10–12% Piramal, Navi BBB High / Very High Above 12% SATYA, KNF, NBFCs Below BBB
Conclusion
- The higher the return offered by a bond, the higher the risk associated with it.
- Government and top-rated bonds are safest but offer lower returns.
- Bonds from private entities or those with lower credit ratings offer higher returns but come with increased risk of default.
Explanation of the Image
The image is a slide from a presentation focused on a “Medium Term based asset allocation strategy.” Here are the key points depicted:
- Asset Allocation Breakdown:
- 40% of the portfolio is allocated to domestic equity.
- 60% is allocated to debt instruments.
- This allocation is visually represented using a colored donut chart, with distinct colors for equity and debt.
- Investment Timeline:
- The recommended investment horizon for this strategy is 3 to 6 years, as highlighted in a dedicated section labeled “Timeline.”
- Visual Elements:
- There is an image of a car on the right side of the slide, possibly used as a metaphor for a medium-term financial goal, such as purchasing a vehicle.
Overall, the slide suggests a balanced approach for medium-term investments, emphasizing a greater allocation to debt for stability, while still maintaining a significant portion in equities for growth over a 3 to 6 year period[1].
Explanation of the Slide: “What should you be doing?”
This slide compares two investment options—Bonds and Equity Saver Funds—based on their expected returns, tax implications, and post-tax returns.
Comparison Table
Particulars Bonds Equity Saver Funds Returns 10–14% 9–11% Tax 30% 12.5% Post Tax Return 9–10% 8–9%
Key Points
Returns
- Bonds are expected to provide annual returns in the range of 10–14%.
- Equity Saver Funds are expected to provide slightly lower returns, between 9–11%.
Tax
- The interest or gains from Bonds are taxed at a high rate of 30%.
- Equity Saver Funds are taxed at a lower rate of 12.5%.
Post-Tax Return
- After accounting for taxes, Bonds yield a post-tax return of 9–10%.
- Equity Saver Funds yield a post-tax return of 8–9%.
What Does This Mean?
- Bonds offer higher pre-tax returns but are taxed heavily, which reduces the effective return you get.
- Equity Saver Funds offer slightly lower pre-tax returns but benefit from a much lower tax rate, resulting in post-tax returns that are not far behind bonds.
Takeaway
When choosing between Bonds and Equity Saver Funds, it’s important to consider not just the headline returns, but also the tax treatment. The lower tax rate on Equity Saver Funds helps narrow the gap in post-tax returns, making them a competitive option for investors looking for tax efficiency and moderate returns.
Returns
• Bonds offer a slightly higher range of returns (10–14%) compared to equity saver funds (9–11%).
Tax
• Bonds are taxed at a higher rate (30%), which is typical for interest income in many tax regimes.
• Equity saver funds are taxed at a lower rate (12.5%), likely reflecting the capital gains tax treatment for such funds.
Long Term Goals (> 6 years)
Asset Allocation Breakdown
• 50% Equity:
Half of the portfolio is allocated to equities (stocks). Equities generally offer higher returns over the long term but come with higher risk and volatility.
• 20% Debt:
A fifth of the portfolio is allocated to debt instruments (such as bonds or fixed income securities). Debt provides stability and regular income, helping to balance the risk from equities.
• 10% Alt Equity:
This likely refers to alternative equity investments, which could include private equity, real estate investment trusts (REITs), or other non-traditional equity assets. These can offer diversification and potentially higher returns.
• 10% REITS:
Real Estate Investment Trusts (REITs) are investment vehicles that own or finance income-producing real estate. They can provide steady income and diversification.
• 5% Gold:
Gold is included as a hedge against inflation and market volatility. It typically moves independently of stocks and bonds.
• 5% Crypto:
A small allocation to cryptocurrencies, which are highly volatile but can offer significant upside potential.
National Pension System (NPS) as an option for long-term financial planning, especially for saving taxes. Here’s a breakdown of the key features mentioned:
- Returns on NPS Investments
• The returns you get from NPS depend on two main factors:
• The pension fund manager you choose.
• The investment category (such as equity, government bonds, etc.) you select.
• This means returns are not fixed and can vary based on market performance and fund management. - Partial Withdrawal Rules
• You can make a partial withdrawal from your NPS account, but there are restrictions:
• Only up to 25% of your own contributions can be withdrawn.
• Withdrawals are allowed only after you have been invested for at least 3 years.
• Withdrawals are permitted only for specific purposes (such as children’s education, marriage, buying a house, or medical emergencies). - Maturity and Withdrawal at Exit
• When you exit NPS at maturity (usually at retirement age):
• 60% of the total accumulated corpus can be withdrawn tax-free.
• The remaining 40% must be used to purchase an annuity plan, which will provide you with a regular pension income.
Explanation of the Comparison: NPS vs Mutual Funds for Long-Term Goals
The slide compares the National Pension System (NPS) with Mutual Funds as investment options for long-term goals, specifically retirement. Here’s a breakdown of the example provided:
Assumptions Used:
- Age at Start: 35 years
- Retirement Age: 60 years
- Annual Contribution: ₹50,000 (for NPS), adjusted for Mutual Funds
Key Comparison Table
Particulars NPS Mutual Funds Annual Investment ₹50,000 ₹34,400 Total Investment ₹12,50,000 ₹8,60,000 Expected Returns 10% 15% Corpus at Retirement Age ₹54,09,088 ₹84,18,092 Capital Gains Nil ₹74,33,092 Final Value (after tax) ₹54,09,088 ₹73,63,935
What Does This Mean?
- Annual Investment:
The amount invested each year. For NPS, it’s ₹50,000. For Mutual Funds, it’s ₹34,400, possibly adjusted to match post-tax corpus comparisons. - Total Investment:
The sum of all annual investments over 25 years (from age 35 to 60). - Expected Returns:
NPS is assumed to generate 10% annual returns, while Mutual Funds are assumed to generate 15%. - Corpus at Retirement Age:
The total amount accumulated by age 60. Mutual Funds, with higher expected returns, accumulate a larger corpus. - Capital Gains:
For NPS, capital gains are considered nil (likely because the entire corpus is tax-exempt at maturity or due to the calculation method). For Mutual Funds, capital gains are shown separately. - Final Value:
The amount available after taxes. For NPS, the entire corpus is available. For Mutual Funds, the final value is after accounting for taxes on capital gains.
Key Takeaways
- Returns:
Mutual Funds, with a higher assumed return rate (15% vs. 10%), result in a much higher corpus at retirement. - Taxation:
The slide notes “Taxation mostly relaxed” for NPS, implying better tax benefits. Mutual Funds are subject to capital gains tax, which reduces the final value. - Final Corpus:
Even after taxes, Mutual Funds provide a higher final value compared to NPS, assuming the higher return rate materializes.
Conclusion
- NPS offers stable returns, tax benefits, and is designed for retirement savings.
- Mutual Funds can potentially offer higher returns but come with higher risk and tax on capital gains.
The choice depends on your risk appetite, return expectations, and tax considerations. This example suggests that, with higher returns, Mutual Funds may outperform NPS for long-term wealth creation, but NPS provides more predictable and tax-efficient retirement savings[1].
Why Not 100% in Equity for Long-Term Goals?
The slide compares two investors starting in 2015:
- Investor A: 100% Equity (Nifty 50)
- Investor B: 65% Equity (Nifty 50), 20% Debt (Bonds), 15% Gold
Reasons Against 100% Equity Allocation
1. Volatility and Risk
- Equity markets, including the Nifty 50, are inherently volatile. A 100% allocation to equity exposes the portfolio to sharp market corrections. This can be stressful and may force investors to sell at a loss during downturns.
2. Diversification Benefits
- By spreading investments across equity, debt, and gold, Investor B reduces overall portfolio risk. Debt and gold often behave differently from equities, especially during market crashes. This diversification helps cushion losses and provides more stable returns.
3. Smoother Returns and Better Risk-Adjusted Performance
- While 100% equity may provide higher returns in a strong bull market, diversified portfolios tend to have smoother returns over time. They may avoid severe drawdowns, allowing investors to stay invested and benefit from compounding.
4. Protection Against Uncertainty
- Debt (bonds) provides stability and regular income, while gold acts as a hedge against inflation and currency risk. These allocations protect the portfolio during periods when equities underperform.
Who Will Make More Money?
- In the long run, Investor A (100% equity) may achieve higher average returns, but with much greater volatility and risk of large losses during market downturns.
- Investor B, with a diversified portfolio, is likely to experience lower volatility and smaller drawdowns, helping them stay invested and potentially achieve better risk-adjusted returns.
- In real-world scenarios, many investors panic and withdraw during market crashes. A diversified approach (like Investor B’s) helps avoid this behavioral pitfall, which can result in better actual (realized) returns for most investors.
Summary Table
Investor Equity (Nifty 50) Debt (Bonds) Gold Risk/Volatility Likely Outcome Investor A 100% 0% 0% High Higher average returns, but higher risk of big losses Investor B 65% 20% 15% Lower Smoother, more stable returns; better risk-adjusted performance
Conclusion
While 100% equity can potentially make more money in the long run, most investors benefit from diversification (like Investor B) because it reduces risk, smooths returns, and helps avoid costly behavioral mistakes. For long-term goals, a balanced approach is usually more practical and sustainable.
Explanation of Drawdown
Drawdown refers to the decline in the value of an investment or portfolio from its highest peak to its subsequent lowest point over a specific period. It is a key metric used to assess the risk and volatility of an investment.
How Drawdown Works
- Peak-to-Trough Decline: Drawdown measures how much an investment falls from its highest value (peak) to its lowest value (trough) before recovering back to or above the previous peak
- Expressed as a Percentage: The drawdown is typically shown as a percentage, which helps investors understand the potential downside risk.
Why Drawdown Matters
- Risk Assessment: Drawdown helps investors gauge how much they could potentially lose during a downturn, making it a crucial measure of risk.
- Recovery Time: The duration it takes for an investment to recover from a drawdown is also important. Some assets recover quickly, while others may take years.
- Investment Decisions: A lower drawdown indicates a more stable investment, while a higher drawdown suggests higher risk and volatility.
Practical Example
Suppose your portfolio peaks at ₹13,000 and then drops to ₹8,500 before recovering above ₹13,000. The drawdown is:
- Amount: ₹13,000 – ₹8,500 = ₹4,500
- Percentage: (4,500/13,000)* 100 = 34.61%
- Ajay and Dhaval both invest ₹5 lakh in equity.
• After 4 years, their investment grows to ₹10 lakh.
• The difference is in how they redeem (sell) their investments.
Ajay’s Approach
• Invested: ₹5 lakh
• Redeemed after 4 years: ₹10 lakh (all at once)
• Tax Paid: ₹46,875
Ajay holds his investment for 4 years and sells everything at once. The entire gain (₹5 lakh) is taxed in a single year.
Dhaval’s Approach (Tax Hack)
Dhaval uses a “systematic redemption” or “step-up” strategy:
• Each year, he redeems just enough to utilize the tax-free LTCG limit.
• In India, LTCG up to ₹1 lakh per financial year per PAN is tax-free. - Each year, Dhaval redeems enough to realize ₹1.25 lakh LTCG.
• Since the tax-free limit is ₹1 lakh, only ₹25,000 would be taxable, but the table assumes clever use of the limit and reinvestment to minimize or eliminate tax.
Key Points
• LTCG Tax-Free Limit: ₹1 lakh per financial year per PAN.
• Tax Saving: By spreading out redemptions over 4 years, Dhaval pays no LTCG tax, compared to Ajay who pays ₹46,875 by redeeming all at once.
• Annual Tax Saving: Up to ₹15,625 per annum (assuming 10% LTCG tax on gains above ₹1 lakh). - Tax profit harvesting
- Mutual Fund Investments: The total amount invested in mutual funds.
• Capital Gains: The profit earned from selling mutual funds (here, ₹5,00,000).
• LTCG Exemption: The amount of long-term capital gains that is tax-free per person per year (₹1,25,000).
• Tax Saved Yearly: The amount of tax saved by utilizing the LTCG exemption.
How It Works
Scenario 1: Only Ramesh
• Investment: ₹40,00,000
• Capital Gains: ₹5,00,000
• LTCG Exemption: ₹1,25,000 (only Ramesh’s exemption used)
• Taxable Gains: ₹5,00,000 – ₹1,25,000 = ₹3,75,000
• Tax Saved: ₹15,625
Scenario 2: Ramesh, Priya & Parents
• Investment: ₹40,00,000 (same total, split among four people)
• Capital Gains: ₹5,00,000 (split among four people)
• LTCG Exemption: ₹5,00,000 (₹1,25,000 exemption each for Ramesh, Priya, and both parents)
• Taxable Gains: ₹5,00,000 – ₹5,00,000 = ₹0
• Tax Saved: ₹62,500
What Is Happening?
By splitting the mutual fund investments and capital gains among four family members (Ramesh, Priya, and both parents), each person can use their individual LTCG exemption limit of ₹1,25,000. This multiplies the total exemption to ₹5,00,000, making all the capital gains tax-free. In contrast, if only Ramesh claims the exemption, only ₹1,25,000 is tax-free, and the rest is taxed.
Key Takeaway
Using the LTCG exemption across multiple family members can significantly increase total tax savings on mutual fund capital gains. In this example, the yearly tax saved increases from ₹15,625 (single person) to ₹62,500 (four people), simply by distributing the investments and gains. - Bitcoin investment
- Bitcoin (BTC)
• Overview: The original and most widely recognized cryptocurrency, often considered a “digital gold.”
• 2025 Outlook: Experts predict a wide range for Bitcoin’s price in 2025, with bullish forecasts as high as $170,000–$230,000, while some conservative estimates expect the price to remain above $70,000. Bitcoin’s finite supply and increasing institutional adoption are major bullish factors, but regulatory risks and volatility remain concerns.
Solana (SOL)
• Overview: Known for its high-speed, low-cost blockchain, Solana is popular for decentralized finance (DeFi) and NFTs.
• 2025 Outlook: Price predictions for SOL in 2025 vary from $220 to $1,000, with an average expert forecast around $500. Solana’s strengths are its speed and low fees, but it has faced network reliability issues.
Binance Coin (BNB)
• Overview: The native token of the Binance exchange, used for trading fee discounts and powering the Binance Smart Chain ecosystem.
• 2025 Outlook: BNB is considered a strong investment due to Binance’s dominance and regular coin burning, which reduces supply. Forecasts for 2025 suggest BNB could reach $1,170–$2,800, potentially doubling or quadrupling from current levels.
Tether (XRP) — Correction: Tether’s ticker is USDT, not XRP
• Overview: Tether (USDT) is a stablecoin pegged to the US dollar, while XRP is the token for Ripple, used for fast international payments.
• 2025 Outlook: Tether is not designed for price appreciation, as its value remains stable at $1. Instead, it is used for transferring value and hedging against crypto volatility. XRP, on the other hand, is expected to see growth if it overcomes regulatory hurdles and achieves wider adoption for cross-border payments.
Ethereum (ETH)
• Overview: The second-largest cryptocurrency, Ethereum is the leading platform for smart contracts and decentralized applications.
• 2025 Outlook: Expert predictions for ETH in 2025 range from $4,000 to $7,200, with optimism driven by ongoing upgrades (like the transition to proof-of-stake) and the growth of DeFi and NFTs. Ethereum’s established developer community and network effects are major strengths, though competition and high gas fees are challenges- Home loan
Does it make sense to buy a home?
If I’m “wasting” money on rent every month, I might as well pay the home loan EMI. EMI is constant, while rent increases every year.
On the other hand, I can save a lot of taxes by getting a home loan. A home is an asset that only grows in value. My dad has five times his money in the last ten years.
These are some common justifications for buying a home.
House amount:
Fill in the Loan-Related Information:
Flat cost: 1,00,000,000
Interiors cost (10-12% of flat cost): 10,00,000
Down payment percentage: <20%
Annual interest rate: 9%6
Loan period in years: 20
Number of applicants for a home loan: 1
Rental and property assumptions include an annual increase in rent of 7%, property appreciation of 7%, property maintenance appreciation of 5%, rental yield of 3%, and property maintenance cost of 1%.
Rent:
a: Details
Current Rent paid: INR 25,000
Maintenance: 3,000
Total Rental Expense: 28,000
d: Total Rent paid during the loan tenure: 1,37,74,485
Asset classes available to you:
Cash: 0%
Fixed Income:
Debt Funds (3-5%)
Gold
Real Estate (6%, 7-8%)
Stock Market/Mutual Funds (15%)
Crypto (15%+)
P2P/Invoice Discounting (8%)
Home prices in India are already in bubble territory, making investments in homes highly illiquid. This diversification strategy is therefore dangerous.
RBI knows everything about us and where our money is
Financial goals based on an asset allocation strategy:
Short-term goals (1-3 years):
– Higher education
– Emergency funds,
– vacations
– electronic gadgets
Mid-term goals (4-6 years):
– Car
– Home
Long-term goals (>6 years):
– Marriage
– Retirement
– Kid’s education
– Kid’s marriage
Short-term investments
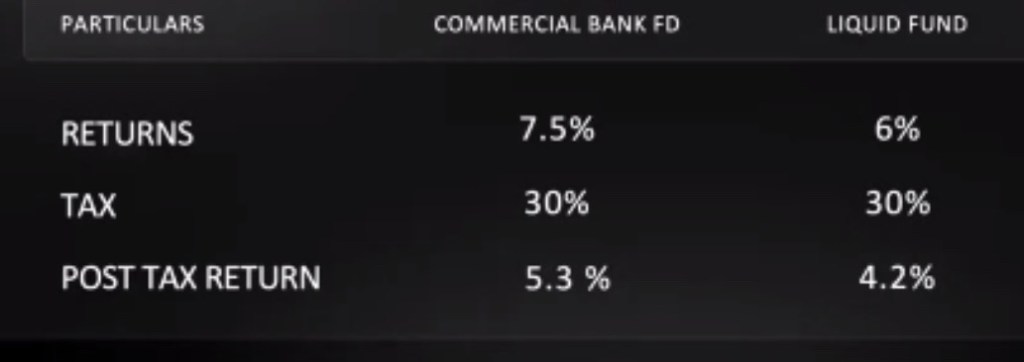

Bond is giving loan to banks. Liquid fund is like liquid mutual fund which acts like FD.
