Machine learning is agent like machine trying to learn models about the process developed from the data itself. Performance measures P has to improve with experience. Machine learning is used for predictions. It is ways to work on data and way to solve business problem. It is used for finding patterns. Finding out the mapping function to find the value of y is called out as prediction. The independent variable is x and the dependable variable is y also called as target/label. In sorting an unlabelled data is given and the data had to be given in an ordered form. Classification: KNN, SVM, NB, Decision Tree and Random Forest.
- Descriptive Analytics: What happened in the past.
- Predictive Analytics: What is likely to happen. Example : What the temperature will be in 15 minutes? Which area is likely to receive rain?
Classification, Regression is predictive analytics.
- Prescriptive: Best course of action depends on various factors. Example : Should I invest in stocks?
- Supervised Learning: Input variable to output variables. When we have label for the data. Feature is also called as a dependent variable. Target variable is a function of dependant variable is a feature of independant variables.
Example : Classification. Build model using existing model which has value for both independent and dependant variable. Alexa is an example of supervised learning. Regression is an example of supervised learning.
Y = f(x)
- Classification: categorical output. Patient is sick or not? Will one will be defaulter or not? Prediction of categorical variable (dependant variable). Sales on advertisement.
Example : Random sample of people administered with dosage to determine the concentration of key component of vaccine.
- Regression: There is a continuous output. Prediction of categorical data(numerical)
- Decision trees: It can be made using classification or regression. Collection of decision trees is called as Random Forest.
- Unsupervised Learning: No output. Discovering patterns in the data, doesn’t necessarily give output. There is no target variable. The data isn’t splitted. There are no labels. There’s image but no labels to them.
- Clustering : Cohesive grouping to find any patterns. Data is divided into groups or segments. All elements in one group are homogeneous or similar to each other like on income, spending, family member, job type, age and gender. Elements in different groups are similar to each other.
Example :
- Drug administration after knowing different thyroid, sugar level, etc.
- Offer for mobile pack recharges based on the amount.
- Selling policy to different types of people according to the policies suitability.
- Association rule mining : frequently co-occur. Association which data is associated with what data. There’s no real output.
Basket analysis : P(Y|X) : Probability that someone has bought X buys Y too.
- Characterisation: Feature of a particular group. It is for segmentation/clustering.
- Discrimination : Features that discriminate two groups.
- Reinforced Learning : Learning how to control a system. No one gives input output pair.
If range is big it is continuous. If the range is small, it is discrete. Example : Self driving cars.
Continuous range : supervised
Discrete range : unsupervised
Measure of error:
- Classifications: classification error. Discrete values. If the values are very small. Dog, cat.
- Regression : prediction error. How far away are you from the actual value that you need to predict. There is no clear distinction between two values. If target variable has large values and numerical. Experience versus the salary. Salary cycle is calculated. Rainfall, weather, etc. It’s for prediction the salary, payback period, etc. It is for predicting the continuous quantity.
- Unsupervised: Scatter/plurity. How tight and how scattered the clusters are. It has no labels.
- Association: How confident you are that the two items are associated. Fractions in which the associations occur.
What is machine learning?
A computer program is said to learn from experience with respect to some class of tasks T and performance keasure P, if its performance at tasks in T, is measured by P, improves with experience E. Chess is an example of machine learning. Every machine learning algorithm works on probability.
What areas are needed for machine learning
Statistics, nueral learning which works on weighted supervised learning. For every action there is a reward. The human programmers make the machines smarter.
What is algorithm.
Measure the performance and see if it improves with learning. Repetition of outcome is called as static programming. It’s a pseudo code and design across for any language like Python, R, C++
Natural logarithm are between 0-1. The complexity of the calculations decreases. First there was linear regression but with addition of features logistic regression came up.
How to resolve a problem?
Know it is actually a problem
Data alternative
Hit and cry
Learn from the past experiencey
What’s the business problem
I’m trying to analyse that which is the best calling plan or I have to give you a calling plan which of talk this information I should consider that is it duration or is it frequency or is it phone numbers. Local industry is seen in general and we could decide that whether we have to give a reference to encircle calling or outside circle calling or outside ISD calls right so 1st to fall I recoupment is what is the problem okay now once you know what problem the second thing is we have to read the data when we read the data what is reading so suppose you have one right it’s easier to say because I have heard is that is one TV it’s very small but is that one TV that a such a small data
do you have done the fitting of data we do the many patients why we
What’s the difference between mean and median?
Median: Mean value changes.
Mean: Used it there aren’t any outliers.
Python libraries for Data Science
- Numpy
- SciPy
- Panda : Filtration and data manipulation
- SkiKit-Learn:
- Matplotlib: Plot the data.
Unsupervised learning is slightly tricky as the output is completely on how the machine interprets.
What do you think it’s a general lack a sample of unsupervised learning.
Machine chooses to learn.
How do we decide what the machine needs to learn and what it doesn’t need to learn.
How is learning unsupervised?
It has no labels or goals.
What are Tensors?
5-Dimensions, multi-dimension array. TensorFlow
What’s the difference between artificial intelligence, machine learning and Deep learning? How we do consider Data analytics using all these terms.
- Artificial intelligence: It enables the machine to think it bout human intervention. This is the final goal. An app which uses ML and AI: self driven cars.
- Machine learning: It is a subset of AI. It provides us statistical tools to explore the data. There are three categories:
- Supervised machine learning : Labelled past data on which prediction can be made for the future. Consider features as height and weight as dataset. Create a model and train on it. Want to classify if someone belong to obese category or fit category. There is past labelled data. We know the output of the data’s
- Unsupervised machine learning : we don’t know the output. We solve the clustering types of techniques. Hierarchical clustering, k mean clustering, DB scan clustering. Based on the similarities of the data it will group the data together.
- Semi supervised machine learning /Reinforcement machine learning: Some part is labelled and some is not labelled. The machine learns slowly by seeing the past data and it will start learning when it sees the new data. It’s used to explore and analyse the data.
Machine learning algorithm are used to predict the future values by applying user experience on the data available . we can use machine learning algorithms to predict the future cost of property in a certain location by using the historical data of the location. we can design an algorithm using the following steps- 1)collection of data: prices of the property for previous years , 2) spliting the data : data is split into two parts test data and train data 3)using algorithm to predict the values : we can use a regression model to predict the value 4)test the predicted values : test the predicted values with test values.
- Deep learning: It is a subset of machine learning. Can we learn how human mind learns. Multi neural network architecture. The main idea is to mimic human brain.
- Artificial neural network (ANN): Most data in the form of numbers.
- Convolution neural network (CNN): If input is in image.
- Recurring neural network (RNN): aid image is in Time series format.
The main purpose is to drive an AI application like a self driving car.
Where does Data science fit into this?
Data science tried to apply AI, ML, DL. It also uses mathematical tools like statistics, probability, linear algebra, differential calculus.
Clustering Analysis: which is of great importance in exploratory data analysis and to find the hidden patterns in the data. 2. It is used in data mining for detecting sequences and patterns. 3. In designing neuaral networks and deep learning models. 4. In density estimation methods(statistics) 5. Unsupervised Learning Algorithms allow users to perform more complex processing tasks compared to supervised learning. 6. It allows the model to work on its own to discover patterns and information that was previously undetected.
| Transport | Probability he is late: |
| Car | 50% |
| Bus | 20% |
Probability that he will come by car/bus/train: 1/3= 0.33
What is the probability of one cluster being in the order cluster.
Classification is the prediction of a categorial variable within a predefined vocabulary based on training examples. The prediction of numerical (continuous) variables is called regression. Classification all the features have to be taken. Indecision really have to take separate features like is it flying on air or on ground etc.
When we talk about classification we have multiple features to check upon.
Definition:
Decision tree is classified in the form of a tree structure. Decision node: specifies A test on a single attribute
Leaf note: indicates the value of the target attribute
Arch/edge: split one attribute
Part: it is junction of test to make the final decision
Decision tree classified instances examples examples were starting at the root of the tree and moving towards it until a leaf node.
A measure of homogeneity of the set of examples.
When we say entropy is zero we have a clear this tension and the outcome is certain.
When it is not zero the outcome is uncertain and there is a loss of data.
Entropy is randomness and we are losing data and there is no meaning of the data. The opposite of it is information gain.
Strength of decision tree:
Can general understandable rules
Perform classification without much computation
Can handle continuous and categorically variables
Provides a clear indication of which fields are most important for prediction classification.
Can be combined the weaker algorithms so they become strong. This process is called as ensemble. We create and assemble which is a combination of various algorithms.
Weak algorithm means individual algorithms will have some corrections, some score.
Concordance Judy theorem (1785): Imagine that a group of people has to select between two choices (from which only one is correct). They would independently, and the probability that they would correctly speak. The words are coming by the majority rule. Let him do note the probability that the majority what is correct.
Concordance theorem says that if p>0.5, M-> 1, if the number of votes goes to infinity.
This means that the crowd is more clever than the individuals under relative weak assumptions.
Every individual must be correct with p>0.5 (better than random guessing)
There should make independent decisions.
Now, how can we apply this ID and machine learning?
Strong versus week learners
Strong learner visit to produce one classifier for which the classification Eric and we Met arbitrarily small.
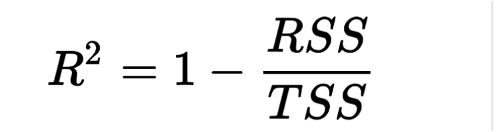
R squared is the proportion of the variance in the dependent variable that is predictable from the independent variable.
TSS: Total sum of squares
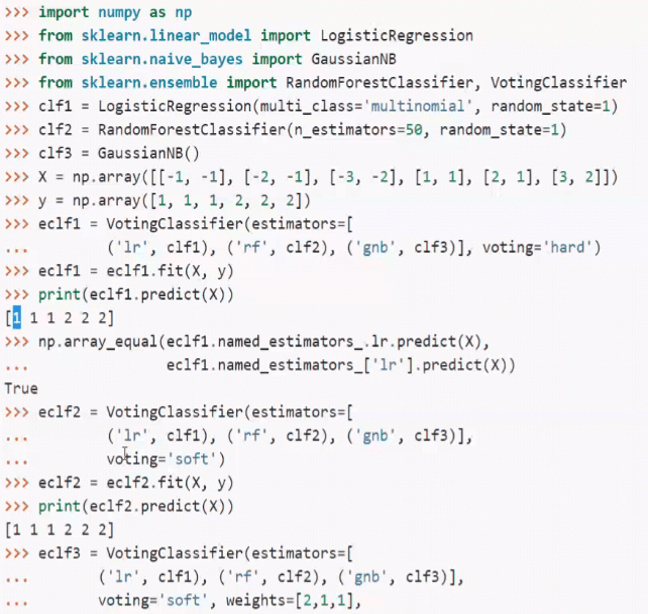
What is the benefit of combining classifieds.
Naïve bayes works on probability.
We take training data and then we slated into training and testing dataset.
Suppose you have hundred lines of data slated into 80% of training data and 20% of testing data. Now there are 10 different algorithms that you want to create into an ensemble.
The 10 different algorithm will be trained. The 20% ensemble will be used for testing purpose.
Supposed to create an army who are trained at different things.
Some manage the food supply, some manage the weapons, some manage the truck, some manage the artillery, some manage the location of the enemy. This combined is called as ensemble.
Why don’t we combine to strong algorithms then we can algorithms.
Every algorithm has its own strengths and weaknesses. Individual algorithms are called as weak algorithm when there combine it becomes a strong algorithm. R score doesn’t have to be zero. Combine multiple algorithms to make them stronger. They will take different decisions. Based on the random state. Random state is for randomization of data.
How to produce diverse classifiers?
We can combine different learning algorithms (hybridisation)
For example we can train a GMM, NSVM, HE – NN, over the same data and then combine their output.
We can combine the same learning algorithm trains old times over the same data.
This works only if there is some random factor in the training method.
Example: New network strain with different random initialisation.
We can combine the same learning algorithm trained over different subset of the training data. You can also try using different subset of the features. A different subset of the target classes (multi-class, log of classes).
For certain algorithms we can use the same algorithm over the same data, but with a different weighting over the data instances.
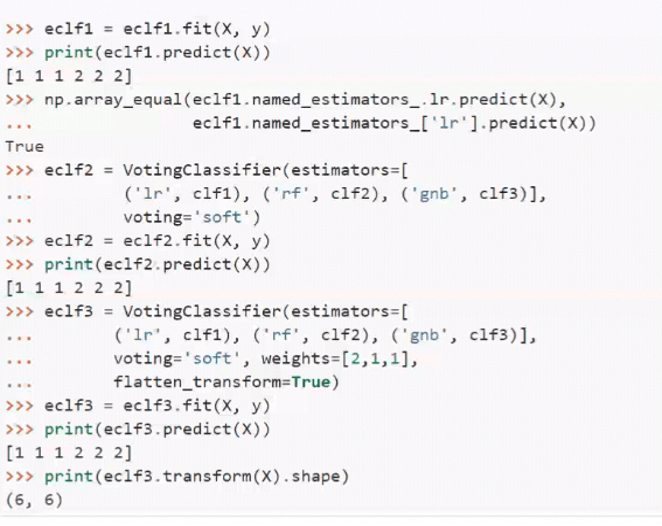
Aggregation methods
There are several methods to combine (aggregate) the outputs of the various classifiers. When the output is the class level:
Majority voting
Weighted majority voting (we can wait each classifier by its reliability which can also has to be estimated somehow)
When the output is numeric (probability estimate of each class C): we can combine the D score by taking the weighted mean, product, minimum, maximum.
Stacking instead of using the above simple aggregation rules, we can train yet another classified on the output values of the base classifier.
Backing
Bagging equal to bootstrap plus aggregating
It uses bootstrap re-sampling to generate L different different training sites from the original training site. On the L training sites in trains always loners. During testing it aggregates the L learners by taking the average (using uniform weights for each classifier) or by a majority voting. The diversity or complementarity of the bagging not control in any way, it is left to chance and to the instability of the peace learning method. The simple model is almost always better than the unique face loners iowners unstable (it means that a small
Modern generation
Let n be number of instances in the train data.
Random forest – and ensemble method for decision trees
Input: training dataset SN, T, M
Choose T – number of trees to grow
Choose — number of variables used to split each note, MM is the number of input variable. MS whole constant will grow in the forest.
Random forest is a combination of decision trees. Random forest with the highest classifier give the answer one so the answer will be 1.
What is decision tree?
This works on the concept of classification. Decision tree induction is the learning of decision trees from class – labelled training tuples. A decision tree is a flow – like tree structure. So non-leaf denotes test on an attribute. The branch represents an outcome of the test. And the least node holds class label.
The minute the error increases we reduce the weight.
